I have broken up our time periods to accurately reflect the movements in our daily lives;
January 1st thru March 15th – the old normal, probably not to be seen for at least a year,
March 16th thru May 31st – the onslaught of Mr. Covid’s visit, while we struggled with the daily changes to our lives as all levels of government struggled to stay ahead of the mounting deaths,
May 31st thru August 15th – it seems this is the period we opened back up, forgot the lessons learned and set the stage for a resurgence in a 2nd visit by Mr. Covid,
August 16th thru October 31st – our resurgence of infections and deaths as the naysayers and irresponsible adults learn the hard way that this is all very real.
In this analysis that I worked on over the weekend, I took the first two periods to look at PRE and POST lockdown periods. California was the first state to mandate the new self-isolation procedures by requiring a complete lockdown of its citizens on March 15th with only exemptions for “essential” services.
I took four communities that represent a wide demographic swath of Los Angeles, just to see for myself where Mr. Covid struck the hardest and who survived, and used only single family residences (SFR) data. You’ll be surprised by the results. BTW, Mr. Covid has financially devastated the working-class communities, much more so than the affluent ones. This analysis is just focusing on real estate values, not job retention or other economic destruction.
Beverly Hills – this city represents the most affluent area in the greater Los Angeles area with the highest property values.
Pasadena – an affluent city comprised of both working class and professionals and a wonderful demographic mix by race, religion, color and education.
Pico Rivera – a strong working-class neighborhood with minimal professionals and entry-level homes.
Woodland Hills – a strong upper-end working-class neighborhood that represents the best of the middle class.
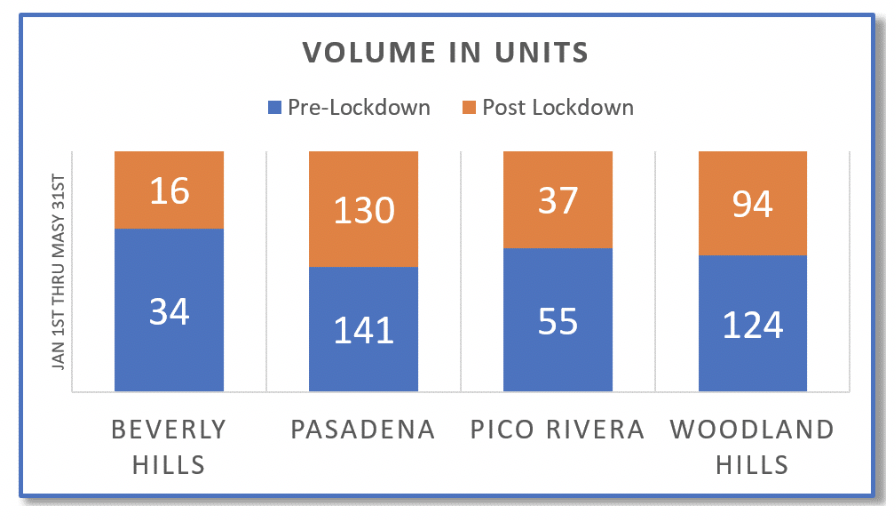
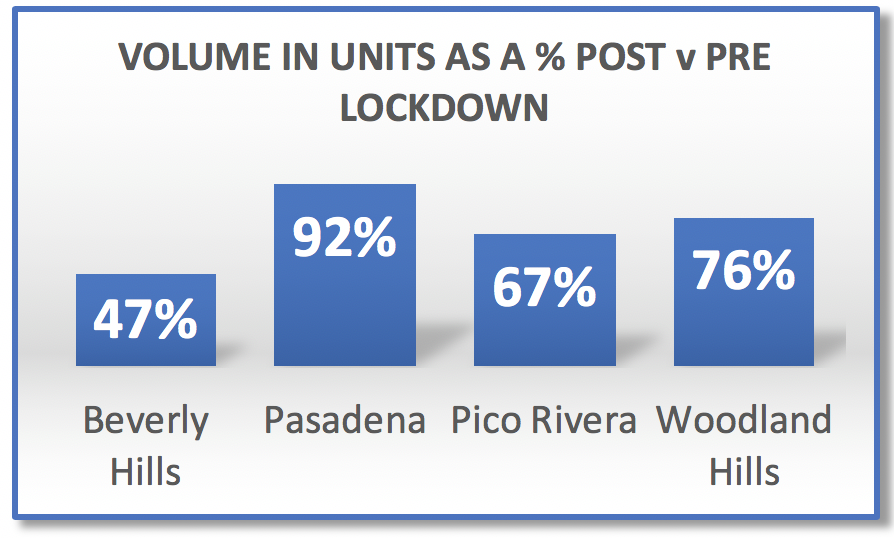
Let’s tackle “volume” first. By choosing a 2 ½ month stretch, we can somewhat measure “mindsets” as they changed with the lockdown mandates. Escrow closings (date of the recorded sale) are preceded by the mindset of looking at properties, choosing a property, negotiating a purchase and performing due diligence to close the purchase. It’s a mindset that precedes the actual closing date by one or two months. The charts are all set up to equal the same 100%, meaning that we want to see the ratios measured by different data and compare them, regardless of the dollar volume size. We all know that there was more dollar volume in Beverly Hills than Pico Rivera. But who cares? We just want to know how they compare side by side using different data points.
Take a look at the first two charts. I’ve set these up with actual data and the percentage changes from PRE (Jan 1st thru March 15th) to POST (March 16th thru May 31st) lockdown dates. The first chart gives us the actual closings PRE and POST periods in each of the four communities. The second chart shows us the difference between those two periods. As you can see, Pasadena fared the best at closing escrows in the POST period that amounted to 92% volume of the PRE period. Beverly Hills fared the worst, closing only 47% in the POST period of the escrows that it closed in the PRE period.
.
Let’s take a look at another measure of real estate activity to compare. How about the “median” price of SFRs sold in those four communities, PRE and POST lockdown? Remember, “median” is not “average”. Median is the point at which exactly half of the homes sold are less than the median point, and half the homes sold are greater than the median point.
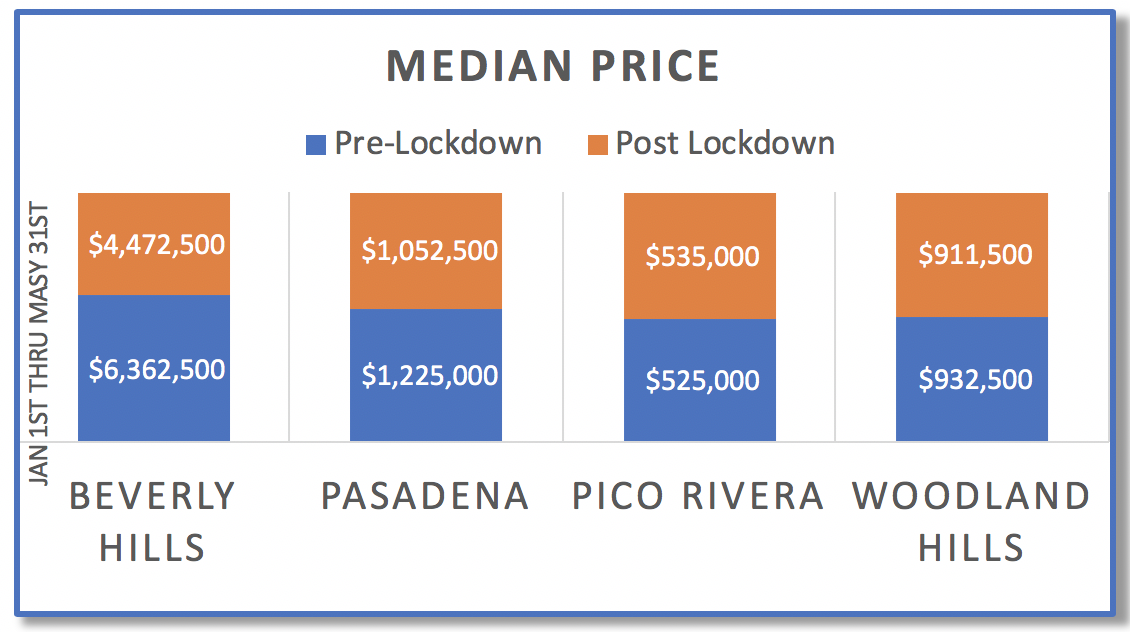
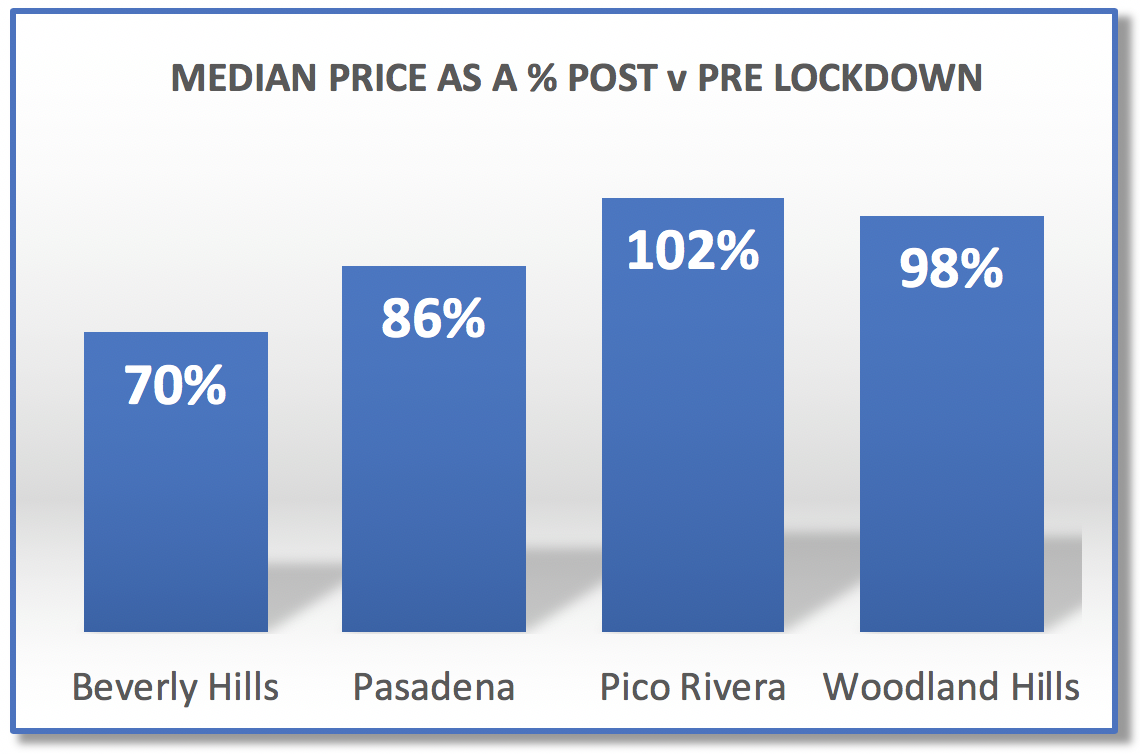
Again, the affluent community of Beverly Hills suffered the most, watching the median price in the POST period drop down to 70% of the median price in the PRE lockdown period. Pico Rivera did the best as the working person’s community, actually seeing a rise in the median price to 102% of POST over PRE periods.
Let’s take a look at the sister statistic, the “average” price point in each community, PRE and POST lockdown periods.
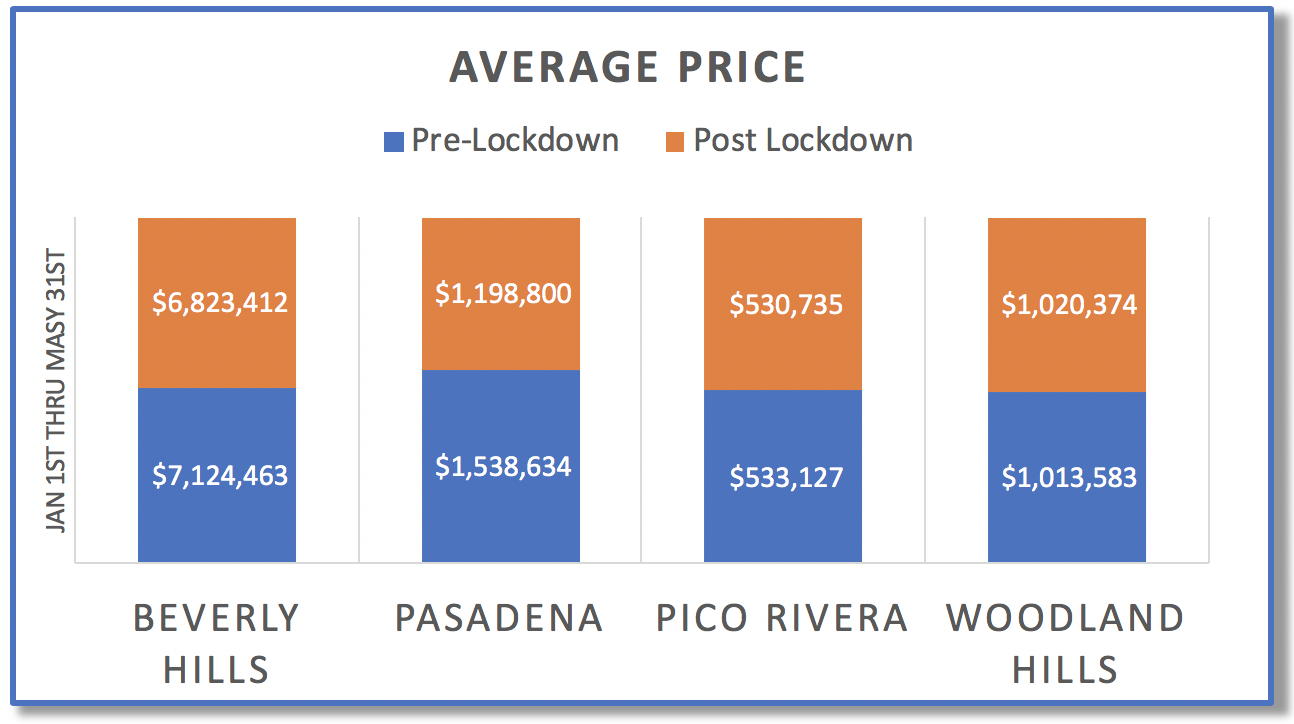
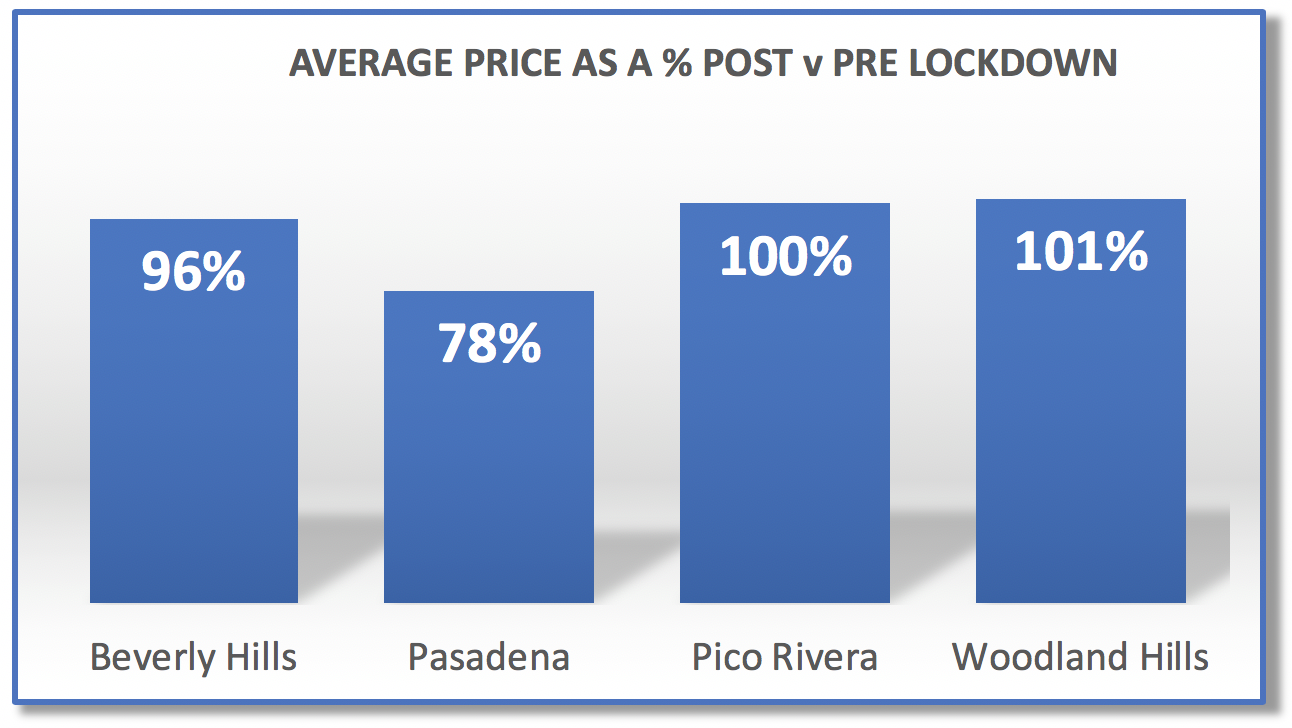
Once again, the “affluent” communities of Beverly Hills and Pasadena did not fare as well as Pico River and Woodland Hills. Are we seeing a trend here?
A fourth measure of changes in real estate values due to Mr. Covid’s visit is $/sq ft. This is interesting because it levels the playing field, allowing us a standard measurement for all communities that ignores the dollar amounts. More than anything else, it may give us an insight into the mindset of buyers who entered into contract following the March 15th lockdown. This really brings our journey here into focus.
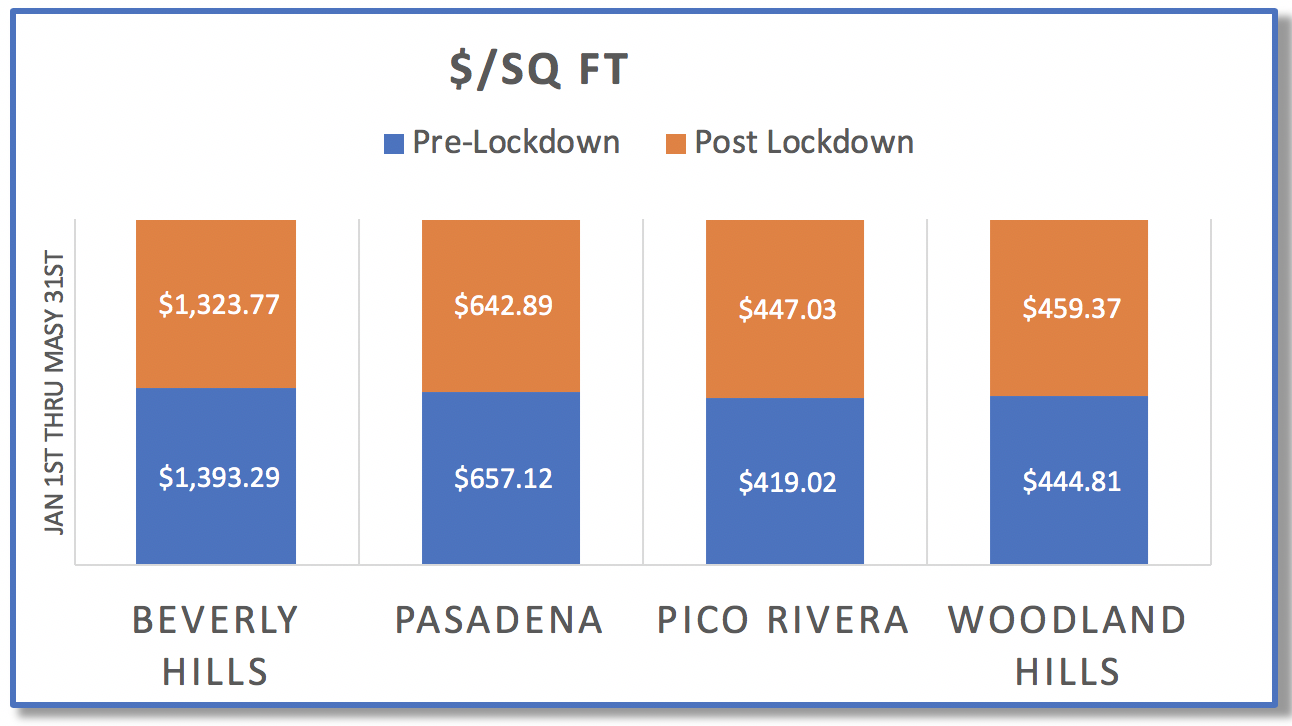
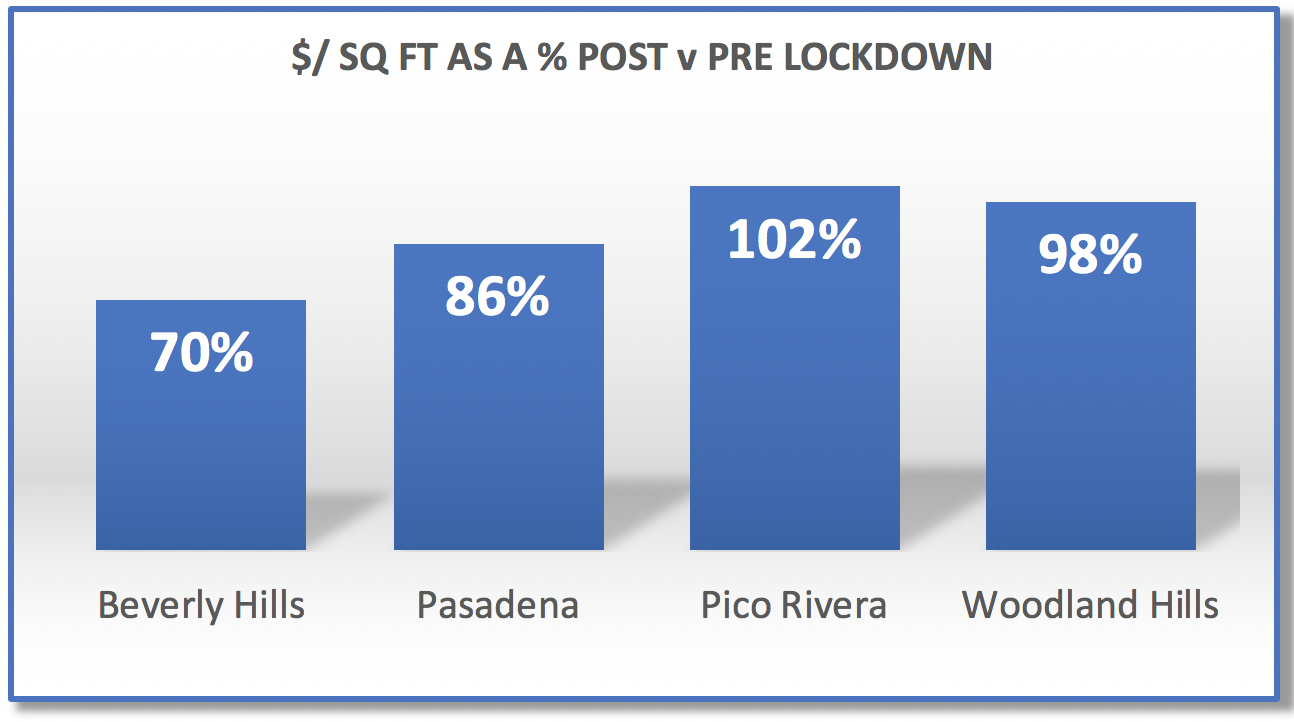
Even a blind man can see the net result here, echoing the previous figures and graphs using different data. What we are seeing here is a pattern that confirms my original contention, that the lower-end markets provided a base where numbers could only go up. Beverly Hills and Pasadena (as affluent communities) have seen values rise to the point that they were artificial with no foundation, and offered Mr. Covid the perfect opportunity to undercut those values and weaponize the news feeds for the buyers to use against the sellers in the mass hysteria that followed the initial lockdown orders.
Let’s dig a little deeper. There is more than one mindset that we can try and identify here. It takes two parties to make a real estate transaction. The buyer can adjust his mindset to align with his assumption of risk in a chaotic environment that initially challenged everyone’s form of income. But the seller can also adjust his mindset as he struggles to anticipate future increased risk levels and determine his appetite for them. When do these two “meeting of the minds” clash and come together? The conversation that takes place between seller and agent before the visit of Mr. Covid is going to be a lot different than the same conversation after the lockdown started and we entered into an unknown abyss as the deaths mounted in the first few weeks. That decision to establish a pricing strategy is also different in PRE v POST. Those conversations took place BEFORE the property entered the market, and thus before the buyer first saw it for sale on The MLS. How did those stack up against each other, PRE and POST periods? Let’s look at actual closing prices and compare against the original listing price at the close of escrows before March 15th (PRE) and the same for after March 15th (POST)?
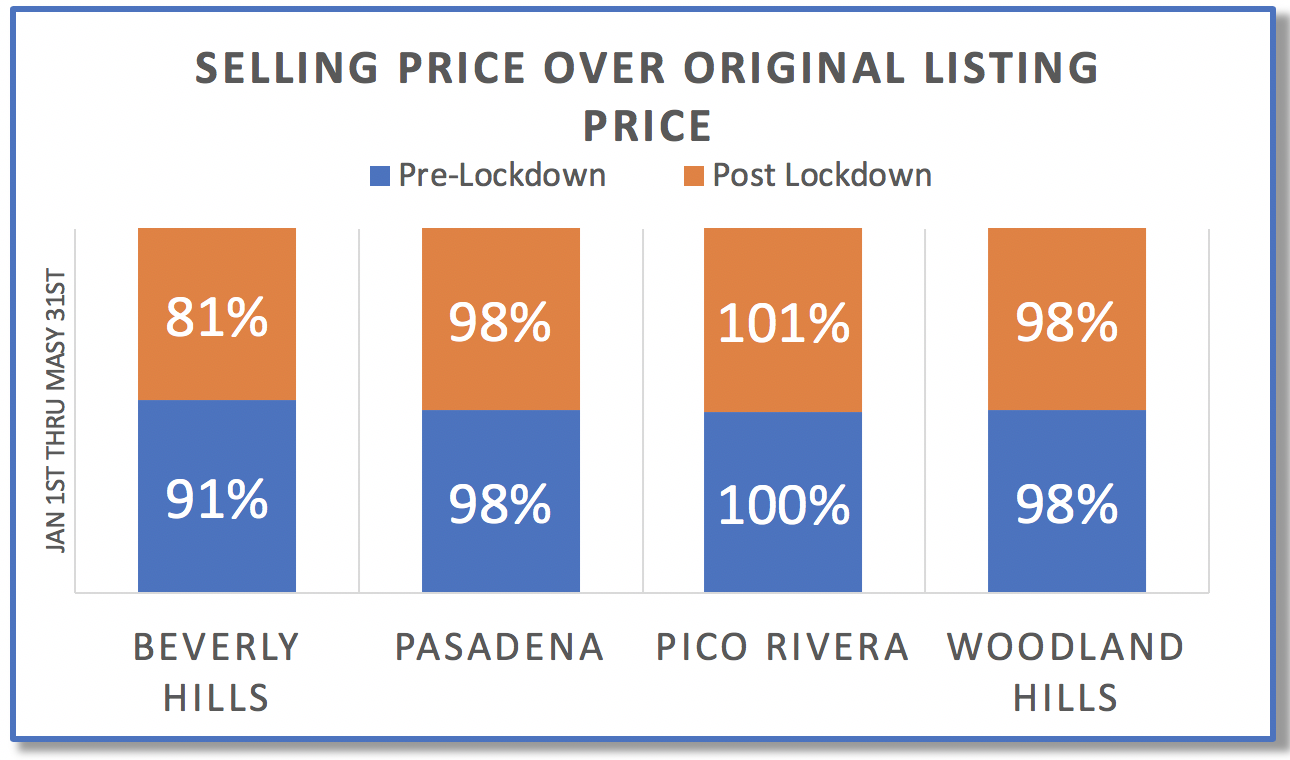
Once again, we see the confirmation of the previous graphs. The Buyers took the sellers to the cleaners in Beverly Hills, demanding deep discounts to close the transactions. In my years as a real estate agent, I’ve never seen an 81% ratio of closing price to original listing price anywhere as we do here in the POST period of Beverly Hills.
We already reviewed the graph showing volume in units. But we want to know how that translated to actual dollars so we can measure volume now by dollars and cents. This measurement highlights the difference between the communities, but is of particular interest to real estate agents, because we are commission based by dollar volume, not unit volume. Here is the data from The MLS for volume by gross dollar. Go ahead and fine tune your conclusions here.
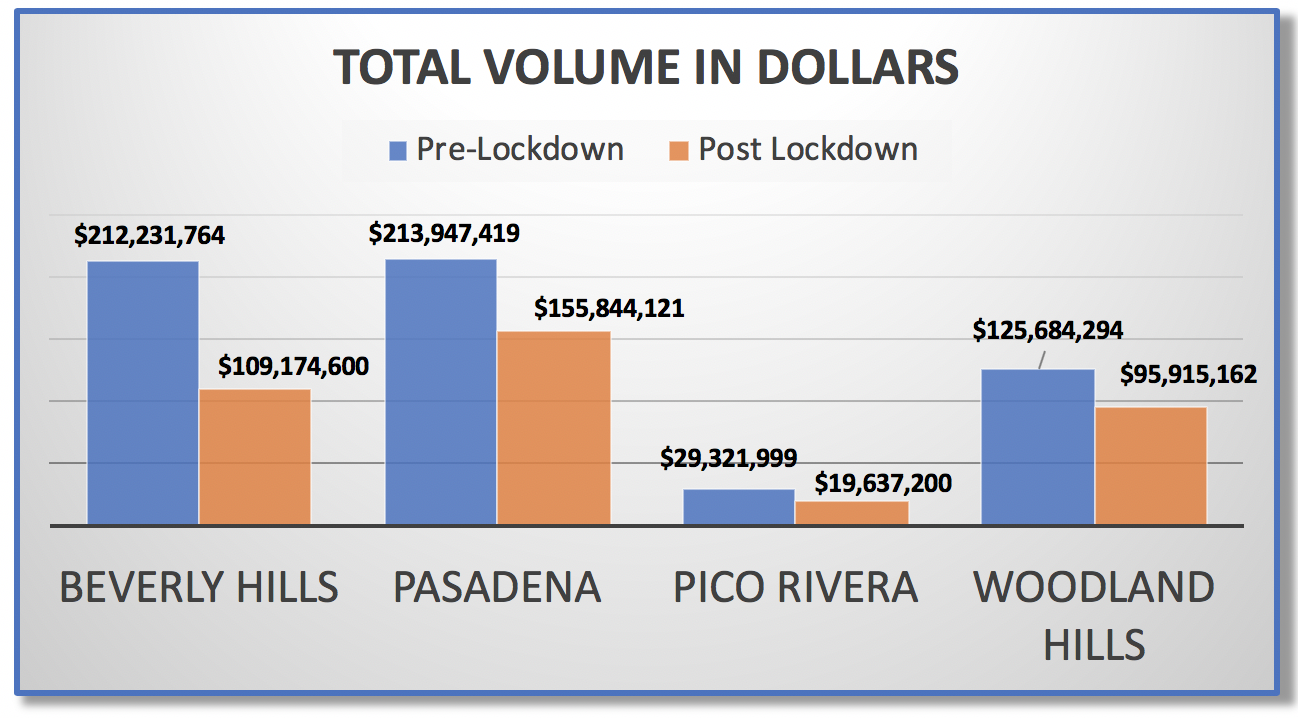
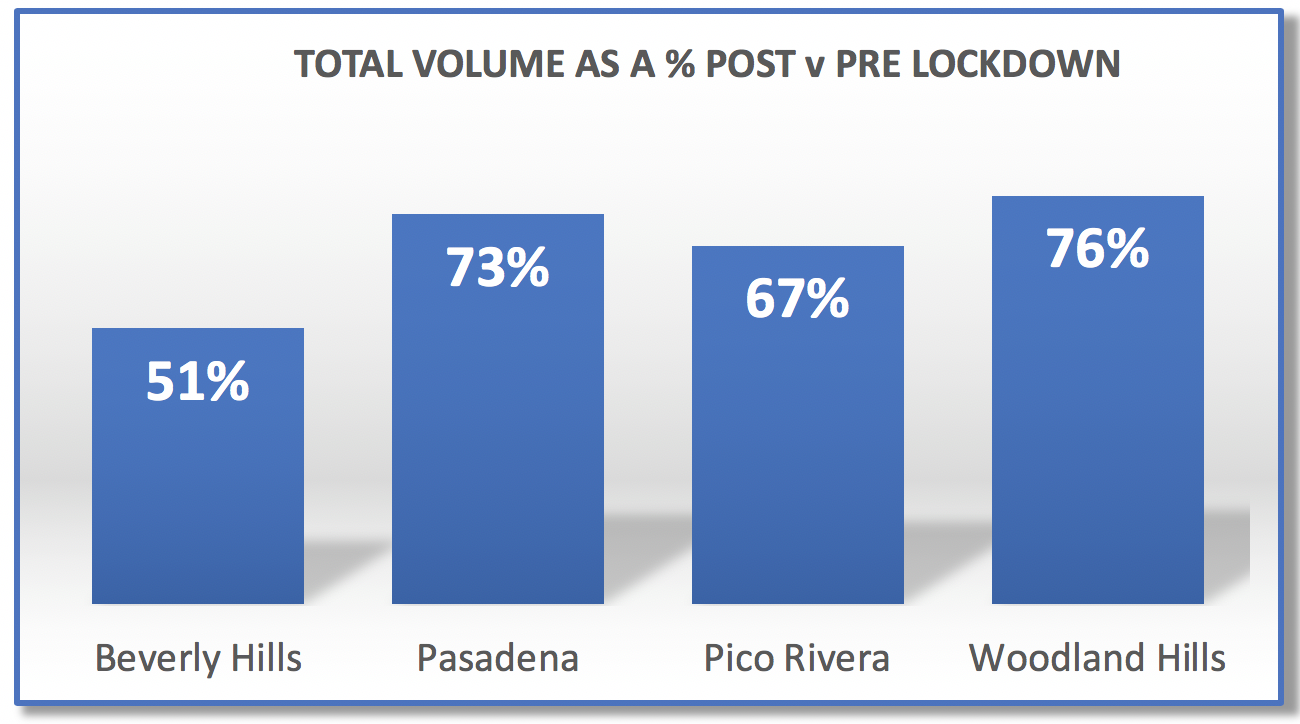
I think we can all arrive at the same conclusion; residential real estate values in single family residences were much more deeply effected in the high-end affluent communities than anywhere else, and in fact real estate continued its march forward in increased values in the lower-end working man communities. I can attest to that because I am in the middle of the working man neighborhoods with a client of ours, making offers in Pico Rivera, Norwalk and Bell Gardens and each time watch the subject property move into multiple offers far above the listed price.
As we move into our new definition of normalcy, I ask all of you to be safe and refuse to let down your guard. Enough people are ignoring the science and moving forward in life on a venue destined for disaster by refusing to wear masks or practice safe distancing. People are dying every day and I don’t want you to be one of them, so please please practice safe distancing, use gloves, wear a mask, wash your hands every two hours and stay at home. Be safe and be healthy.
— Mark Rogo

Recent Comments